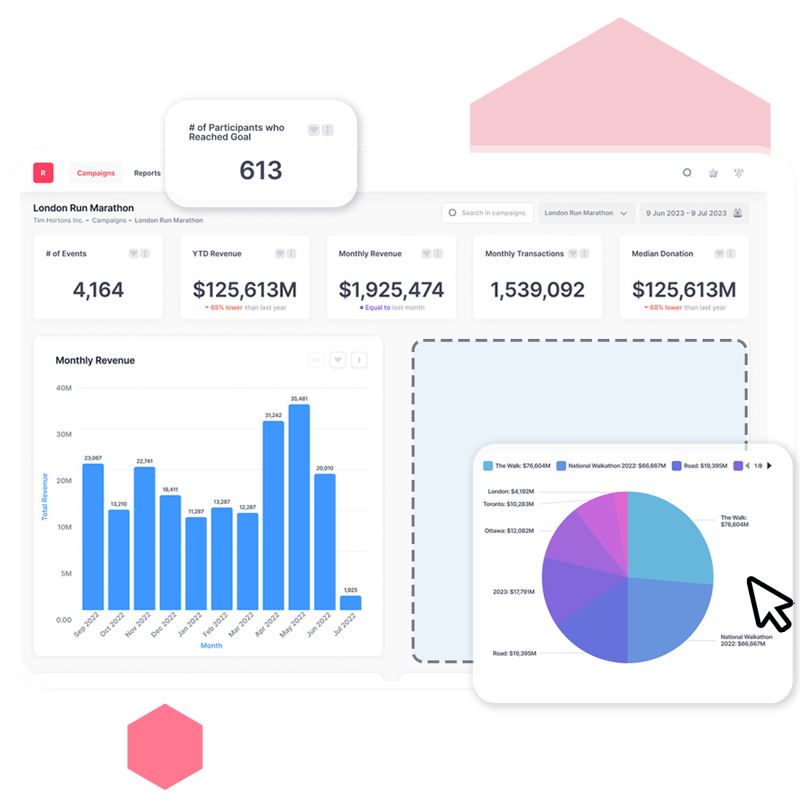
Charting a course with Analytics
Analytics has arrived. Missed the virtual event on October 3? Sign up for a recording, and explore the intuitive fundraising dashboards and flexible reporting tools at your fingertips with raisin. Discover how to your start mapping your data into clear, actionable strategies. You'll learn how to:
- Maximize fundraising with Organization and Campaign Dashboards
- Segment data across key dimensions
- Value of personalized reporting
- Plus, a few tips that we've picked up with Analytics to answer tricky fundraising challenges
Grab a recording
Explore effortlessly, focus precisely, act confidently

Spot-on insights, on the spot
All of your campaigns together in one powerful place. Dynamic, pre-built dashboards visualize the most meaningful fundraising metrics, making it easy for you to monitor progress, celebrate wins, and spot opportunities as they happen.
Uncover what matters
Engage your data through drill-downs, apply filters on almost any dimension, re-order and re-label columns (and much more) and unlock your full fundraising potential. It's time to kiss the spreadsheets and aging external tools goodbye!
Personalize everything
Whether you're dropping in new insights from our library of suggested charts, rearranging them for a better flow, or choosing different chart types to better illustrate your achievements, Analytics will always work the way you do.
Action your analysis
Be more data-driven, truly. Share your newly-discovered insights up and down our team. With the right details presented in the right way, you'll make more informed decisions quickly and confidently.

Client feedback from Beta
I love that we could add and remove columns as needed or filter info based on payment type and campaign(without having to memorize an ID number). This has saved us so much time in terms of bookkeeping, but also in sorting information quickly.
